Skip to main content Accessibility Statement
Author


Rebecca Robinson

Data Analyst (Higher Education Insight), QAA

Welcome to your monthly round-up of essential data news and insights. These short briefings cut through the noise -bringing you the latest data releases, key trends, and standout analysis. Whether you use data to inform decisions, support strategy, or stay on top of sector developments, we’ll highlight what you need to know.

Data releases


Higher education students in Scotland 2023-24 

Data released by SFC shows that there were 155,040 entrants to higher education (HE) at Scottish institutions in 2023-24, down from 164,435 in 2022-23 (down 5.7%). HE entrants to colleges were down 6.2% while entrants to universities were down 5.6%. The decrease was driven by a drop in non-EU entrants to postgraduate courses.


Student loans to financial year 2025 

Data for all UK nations was released by the Student Loans Company earlier this month covering a range of indicators. A summary comparing the different nations shows that the outstanding student loan balance for all government administrations is increasing. The UK total for 2024-25 was £294.1 billion, up from £260.8 billion in 2023-24. The average loan balance on entry into repayment varies by nation (because of the various different funding models) – for 2024-25, the figures were £17,990 for Scotland, £28,050 for Northern Ireland, £39,470 for Wales and £53,010 for England.  

Early in-year student withdrawals 

The SLC publishes provisional data each year on in year withdrawals to provide insight into potential trends. Note that only students approved for funding by SLC are included, the data doesn’t cover the full UK student population (in particular, Scottish domiciled students are not included as withdrawal notifications for these students are not handled by SLC). The latest data shows student withdrawals as a proportion of total undergraduates in 2024-25 was 1.9%, unchanged from 2023-24.  

Student visa update 

Monthly figures for sponsored study visa main applications continue to recover – with the figure for May 2025 (18,500) up compared to May 2024 (15,500). 

UK revenue from education related exports and trans-national education 

DfE’s annual estimate of revenue from education related exports shows total UK revenue in 2022 of £32.3 billion, up 9.5% from 2021 (in current prices). As part of this, HE trans-national education (TNE) activity generated £0.67 billion, up from £0.53 billion (up 26%), while HE delivered in the UK for international students generated £23.7 billion (up 6.3% from £22.29 billion).  

Apprenticeship starts in Wales and Northern Ireland 

The latest quarterly data on apprenticeship starts in Wales was released at the start of June. Apprenticeship starts (across all levels) for 2024-25 Q2 were down compared to the same period in 2023-24 (3,620 compared to 4,525). Starts were down across all levels with level 2 and level 4+ apprenticeships both down by 15% and level 3 apprenticeships down by 26%. This data can be explored in more detail via Medr’s interactive dashboard for apprenticeship starts. 

Data for apprenticeships in Northern Ireland for all of 2023-24 was also released this month, covering apprenticeships up to level 3. This data showed 7,519 starts in 2023-24, up from 5,096 in 2022-23.  

Destination of school leavers in Scotland 

Scottish Government statistics released in June on destinations of school leavers for 2023-24 show that 38.1% of school leavers went into higher education and 21.9% into further education – both figures up slightly compared to 2022-23. Destinations vary by deprivation with 59.3% of school leavers from the least deprived areas going into HE compared to 24.6% from the most deprived areas. The opposite is true for FE – 12.9% from the least deprived areas go on to FE study compared to 29.9% from the most deprived areas.   


""


Longitudinal Education Outcomes 2022-23  

The latest release of LEO – data looking at the long term earning outcomes of graduates – covers UK domiciled first degree graduates with data up to the 2022-23 tax year included. Across the middle 90% of providers, median graduate earnings, five years after graduation, range from £20,400 to £42,000 and the proportion of graduates in sustained employment, further study or both ranges from 71.4% to 95%. 

The release includes a dashboard which allows you to explore the data through various lenses including provider, region and characteristics. 

Graduate Labour Market statistics 

The Department for Education annual release of graduate labour market statistics showed that 87.6% of working age graduates were in employment in 2024 (unchanged from 2023), while 67.9% were in high-skilled employment (up 1.1ppts from 2023). The equivalent figures for non-graduates were 68% and 23.7% respectively. Looking at postgraduates, 90% were in employment and 79% were in high-skilled employment.  

League table releases 

The Complete University Guide released its 2026 league table with the providers in the top 10 unchanged (though with some movement within the top 10).  

Also updated this month was the QS World University Ranking. Four UK providers are in the top 10 (Imperial College London, Oxford, Cambridge and UCL) with 17 in the top 100 (up from 15 last year). In its commentary, QS notes the rise of Asian universities in the rankings. 


UNESCO international higher education data 


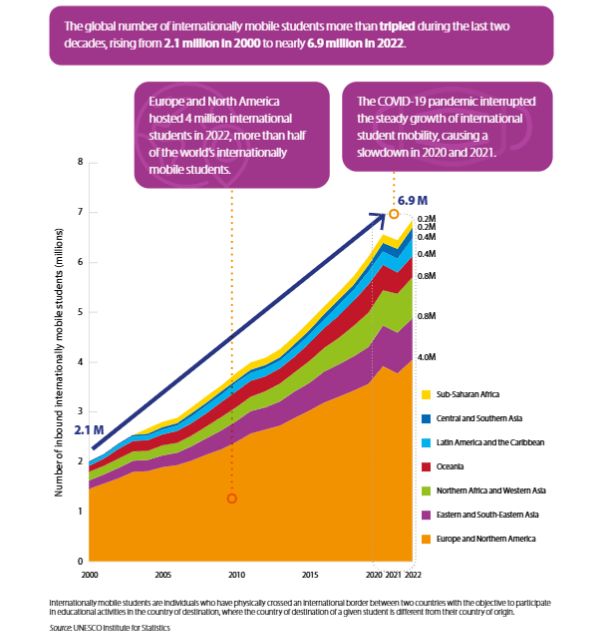
UNESCO published a report in June looking at higher education figures across the world. The data shows that global tertiary enrolments for 2023 were at 264 million students, with women outnumbering men (137 million and 127 million respectively). The number of internationally mobile students has risen from 2.1 million in 2000 to 6.9 million in 2022. More than half of these students are hosted in Europe and North America.  


Analysis in the sector


Student experience 

This month saw several reports released covering aspects of student experience. 

HEPI/Advance Student Academic Experience Survey 2025  

HEPI and Advance HE released the results of the annual Student Academic Experience Survey (SAES) – capturing the views of over 10,000 full-time undergraduate students across the UK – with key findings including: 

  • The proportion of respondents that say they are happy with their choice of institution and course is down to 56%, with 11% of respondents now saying they would choose not to enter higher education if they had the choice again. 

  • Over two-thirds of students are in paid employment in term time (68%) – the highest proportion in the survey’s history.  

  • Study related workload hours are down compared to 2024, with significant change to the average number of independent study hours reported (11.6 in 2025, 13.6 in 2024). 


Fulfilment and Outcomes – the student experience in 2025 

The third part in the UPP Foundation’s inquiry into widening participation looks at qualitative data from students in Nottingham on the student experience. The report highlights differences in experience between residential and commuter students and, echoing the findings of the SAES, notes that the majority of participants in the research have part-time jobs, limiting the time available to them for wider aspects of the student experience. 

International student experience 

A report from Etio on global student experience based on the results from the 2025 International Student Barometer (a global survey of international students) includes a section on experiences of AI plus a regional focus on responses from international students studying in the UK. 

The report notes that, globally, 26% of international students use AI tools daily and 94% are positive about the impact of AI based tools on their learning experience.  The survey covered 33,000 international students studying in the UK and found that 90% are satisfied overall and 80% would recommend their institution.  


""


Student experience of disadvantaged students 

Research by Unite Students, using data from its Applicant Index combined with qualitative research with students from University of Leeds and Manchester Metropolitan University, covers key concerns for disadvantaged students and offers student-led recommendations to improve the student experience. The research notes that disadvantaged students are 10% less likely to complete their degree, 27% less likely to expect to feel welcome at university and 48% less likely to be able to ask friends or family for financial support. 

Understanding SHAPE graduates 

policy toolkit from The British Academy includes analysis of LEO data and Labour Force Survey data to understand outcomes for graduates of SHAPE degrees (Social Sciences, Humanities and Arts for People and the Economy). Alongside the analysis and policy briefing, an interactive dashboard lets you explore the sectors graduates are employed in, where graduates live and how much they earn, with the option to compare between SHAPE and STEM graduates.   

UK higher education, immigration and financial sustainability 

The Tony Blair Institute for Global Change published a report summarising the data available around university finances and the role of international student recruitment in financial sustainability for providers. The report notes that international students make up 25% of the student population but pay 47% of all tuition fees. 

TRAC 2023-24 

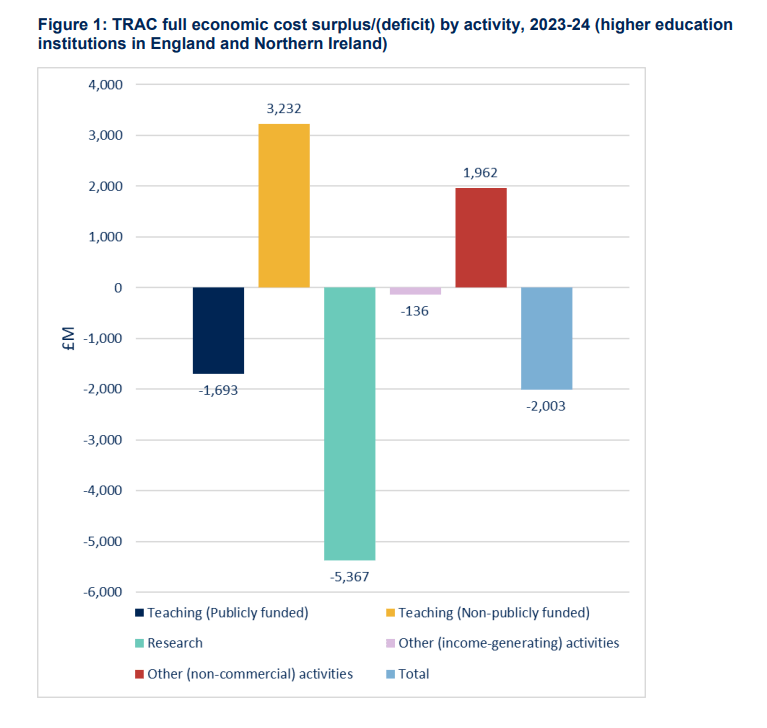
OfS released analysis, covering providers in England and Northern Ireland, of the latest TRAC (Transparent Approach to Costing) data, submitted by providers in January this year. The analysis shows a sector aggregate deficit of £2,003 million (95.7% of full costs recovered). This compares to a deficit of £2,854 million (93.6% recovered) in 2022-23.  

Publicly funded teaching incurred a deficit of £1,693 million (up from £1,515 million for 2022-23) while non-publicly funded teaching continues to generate a surplus - £3,232 million (up from £3,004 million in 2022-23). 

Image taken from OfS Annual TRAC 2023-24 report 
Screenshot 2025-07-02 173455

Data news

 
In-year collection of student data 

The OfS published a letter to accountable officers setting out its phased approach to achieving in-year collection of student data. The letter notes the aim to design ‘an efficient system that minimises the burden on providers’ and discusses how part of the work will look at reducing the complexity of the student data model. The three phases are: seeking input from data colleagues between summer and autumn this year, two years of development time to autumn 2027 and two years trialling and evaluating, with the aim of beginning to embed in-year data collection by autumn 2029. 


Previous editions

Data Insights: June 2025
""